As part of the commitment to support climate change policy, the CHE project is addressing the challenges of developing a CO2 emissions monitoring support capacity. Among these challenges is the assessment of the requirements for future space missions dedicated to the monitoring of CO2. This assessment needs to be done in the framework of Observing System Simulation Experiments (OSSEs) which are based on a reference simulation or nature run used as the truth, from which synthetic observations can be produced. As the nature run is taken to be the truth, the simulation is required to represent a realistic variability of the observed parameters. In this context, the CHE project aims to provide a library of simulations at different scales from global to regional to local which can be used as nature runs to sample the atmospheric variability associated with regional and local sources/sinks to point sources of CO2 at the surface. The CHE deliverable D2.1 describes the configuration of the different nature runs and their domains and resolutions. The nature run presented here is the CHE Tier1 global nature run, which is the first step towards building this library of simulations.

PublishedAugust 02, 2018
The CHE Tier 1 CO2 global nature run
PublishedAugust 02, 2018
The CHE Tier 1 CO2 global nature run
PublishedAugust 02, 2018
The CHE Tier 1 CO2 global nature run
PublishedAugust 02, 2018
The CHE Tier 1 CO2 global nature run
What is the CHE Tier1 global nature run?
The CHE Tier 1 global nature run is a 9-km free-running tracer simulation with state-of-the-art IFS model transport based on the operational CAMS high resolution global CO2 forecasting system. The main advantage of using the CAMS operational system is that it can be made available in a timely manner in order to provide boundary conditions for the regional simulations in the CHE project (D2.1).
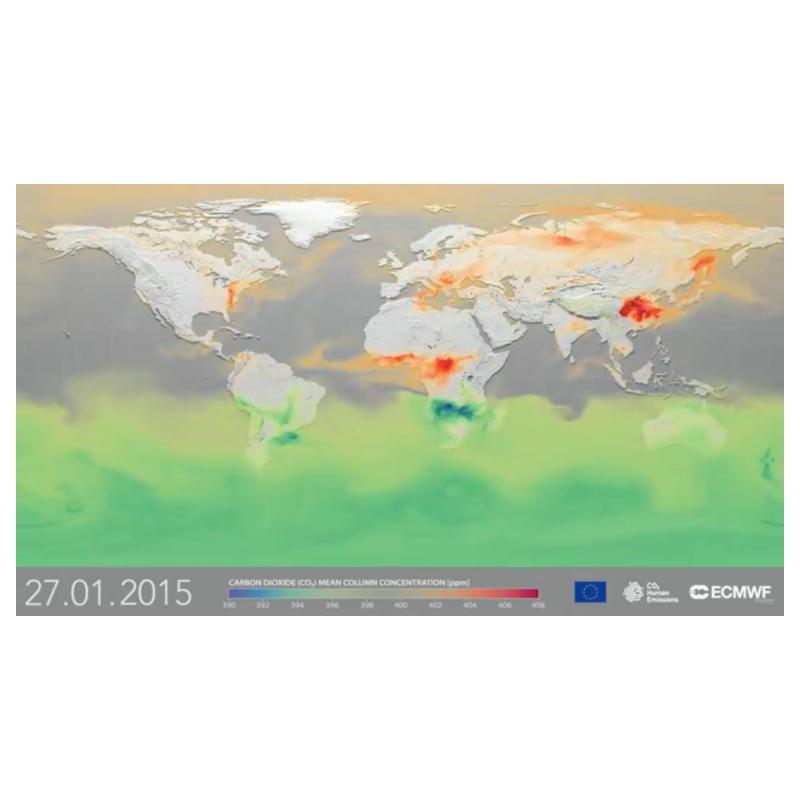
The global simulation is configured as a sequence of 1-day forecasts of atmospheric CO2, CH4 and linear CO and all the standard Numerical Weather Prediction (NWP) fields issued every day from 00UTC using the Integrated Forecasting System (IFS) model at the European Centre for Medium-Range Weather Forecasts (ECMWF). The meteorological initial conditions of each 1-day forecast come from the ECMWF operational NWP analysis. The CO2, CH4 and linear CO tracers are initialised with the previous 1-day forecast, in a cyclic mode, which means they are essentially free-running fields. The nature run covers the period from 1 January 2015 to 31 December 2015. The initial conditions for the tracers on 1 January 2015 have been extracted from the CAMS GHG analysis (Massart et al., 2014, 2016) for CO2 and CH4 and from the CAMS near-real time analysis (Inness et al., 2015) for CO. NWP analysis of meteorological fields is one of the main elements determining the quality of the transport (Locatelli et al. 2013). Therefore, ensuring the meteorological fields are close to the analysis by having a sequence of 1-day forecasts ensures that the transport is as realistic as possible.
The tracer transport and CO2 biogenic fluxes, which are two of the largest contributors to the variability of CO2, are modelled online in the IFS (Agusti-Panareda et al., 2014 and Agusti-Panareda et al., 2016). The anthropogenic emissions from EDGARv4.2RT2010 (Olivier and Janssens-Maenhout, 2015) and other fluxes such as the biomass burning (Kaiser et al., 2012) and ocean fluxes (Takahashi et al., 2009) are prescribed. Further details on the transport model and fluxes can be found in Agusti-Panareda et al. (2014, 2016, 2017) and the CHE deliverable D2.2.
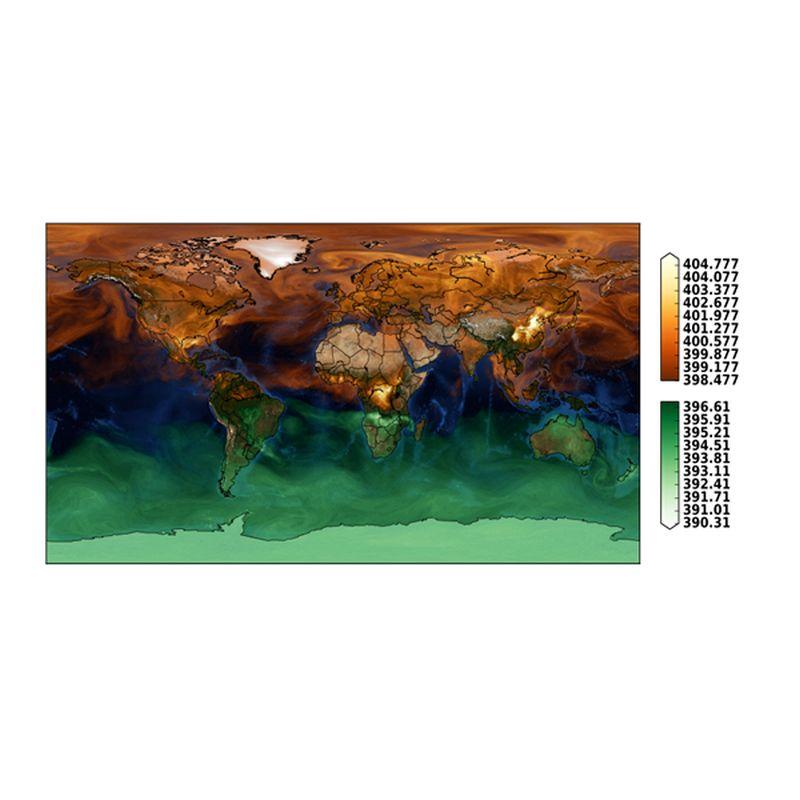
The global nature run encompasses the variability of CO2 at different scales, from seasonal large-scale patterns such as the gradients between southern and northern hemispheres, to zonal gradients associated with synoptic weather systems (see upper panel in Fig 1). The high resolution can also add to the detail and intricacies of the mesoscale variations and the plumes emanating from point sources as shown in the lower panel of Fig 1.

How can the CHE Tier1 global nature run be used?
The CHE T1 global nature run provides 3-hourly 3-D fields of CO2 and other tracers (CH4, linear CO and emission-tagged tracers for CO2, CH4 and CO) depicting realistic seasonal cycle, day-to-day synoptic variability and diurnal cycle. The focus of the simulation is 2015, giving the opportunity to compare the high resolution global simulation with Greenhouse gases Observing Satellite (GOSAT) and Orbiting Carbon Observatory-2 (OCO-2) satellite data, as well as in situ and Total Carbon Column Observing Network (TCCON) (Wunch et al., 2011) data as shown in Figures 2 and 3.


Details of the data available from the CHE Tier1 global nature run can be found in the CHE D2.2 deliverable. The data can be used in a variety of applications:
- Observing System Simulation Experiments (OSSEs).
- Boundary conditions for regional models.
- Comparison with other models from CHE and the wider scientific community.
- Exploring the capability of NWP model to simulate anthropogenic plumes.
- Supporting interpretation of observations from field campaigns.
How to access the CHE T1 global nature run data
The output fields are provided at 3-hourly intervals with a maximum horizontal resolution of 0.1x0.1 degree on a regular latitude/longitude grid. The data can be currently accessed via ECMWF MARS archiving system. The experiment ID is “gvri” (stream=LWDA, class=RD). The data will also be made available publicly from a web-based data catalogue in the near future. Information on how to access the data catalogue will be published shortly on the CHE website.
References
Agustí-Panareda, A., S. Massart, F. Chevallier, S. Boussetta, G. Balsamo, A. Beljaars, P. Ciais, N.M. Deutscher, R. Engelen, L. Jones, R. Kivi, J.-D. Paris, V.-H. Peuch, V. Sherlock, A. T. Vermeulen, P.O. Wennberg, and D. Wunch: Forecasting global atmospheric CO2, Atmos. Chem. Phys., 14, 11959–11983, 2014.
Agustí-Panareda, A., S. Massart, F. Chevallier, G. Balsamo, S. Boussetta, E. Dutra, A. Beljaars: A biogenic CO2 flux adjustment scheme for the mitigation of large-scale biases in global atmospheric CO2 analyses and forecasts, Atmos. Chem. Phys., 16, 10399–10418, 2016.
Agustí-Panareda, A., M. Diamantakis, V. Bayona, F. Klappenbach, and A. Butz: Improving the inter-hemispheric gradient of total column atmospheric CO2 and CH4 in simulations with the ECMWF semi-Lagrangian atmospheric global model, Geosci. Model Dev., 10, 1–18, 2017.
Deutscher, N., J. Notholt, J. Messerschmidt, C. Weinzierl, T. Warneke, C. Petri, P. Grupe, K. Katrynski. TCCON data from Bialystok, Poland, Release GGG2014R1. TCCON data archive, hosted by CaltechDATA, California Institute of Technology, Pasadena, CA, U.S.A. \doi{10.14291/tccon.ggg2014.bialystok01.R1/1183984}, 2017.
Kaiser, J. W., Heil, A., Andreae, M. O., Benedetti, A., Chubarova, N., Jones, L., Morcrette, J.-J., Razinger, M., Schultz, M. G., Suttie, M., and van der Werf, G. R.: Biomass burning emissions estimated with a global fire assimilation system based on observed fire radiative power, Biogeosciences, 9, 527–554, doi:10.5194/bg-9-527-2012, 2012.
Kivi, R, Heikkinen, P., Kyrö, E. TCCON data from Sodankylä (FI), Release GGG2014.R0, doi: 10.14291/tccon.ggg2014.sodankyla01.R0/1149280, 2017.
Olivier and G. Janssens-Maenhout, CO2 Emissions from Fuel Combustion -- 2012 Edition, IEA CO2 report 2012, Part III, Greenhouse-Gas Emissions, ISBN 978-92-64-17475-7. http://edgar.jrc.ec.europa.eu/news_docs/jrc-2015-trends-in-global-CO2-emissions-2015-report-98184.pdf, 2015.
Takahashi, T., Sutherland, S., Wanninkhof, R., Sweeney, C., Feely, R., Chipman, D., Hales, B., Friederich, G., Chavez, F., Watson, A., Bakker, D., Schuster, U., Metzl, N., Yoshikawa-Inoue, H., Ishii, M., Midorikawa, T., Nojiri, Y., Sabine, C., Olafsson, J., Arnarson, T., Tilbrook, B., Johannessen, T., Olsen, A., Bellerby, R., Körtzinger, A., Steinhoff, T., Hoppema, M., de Baar, H., Wong, C., Delille, B., and Bates, N. R.: Climatological mean and decadal changes in surface ocean pCO2 , and net sea-air CO2 flux over the global oceans, Deep-Sea Res. Pt. II, 56, 554–577, 2009.
Wunch, D., Toon, G. C., Wennberg, P. O., Wofsy, S. C., Stephens, B. B., Fischer, M. L., Uchino, O., Abshire, J. B., Bernath, P., Biraud, S. C., Blavier, J.-F. L., Boone, C., Bowman, K. P., Browell, E. V., Campos, T., Connor, B. J., Daube, B. C., Deutscher, N. M., Diao, M., Elkins, J. W., Gerbig, C., Gottlieb, E., Griffith, D. W. T., Hurst, D. F., Jiménez, R., Keppel-Aleks, G., Kort, E. A., Macatangay, R., Machida, T., Matsueda, H., Moore, F., Morino, I., Park, S., Robinson, J., Roehl, C. M., Sawa, Y., Sherlock, V., Sweeney, C., Tanaka, T., and Zondlo, M. A.: Calibration of the Total Carbon Column Observing Network using aircraft profile data, Atmos. Meas. Tech., 3, 1351-1362, https://doi.org/10.5194/amt-3-1351-2010, 2010.
RELATED
PublishedMarch 15, 2021
CHE Grand Finale and Start of CoCO2
A very successful CHE final review on 26 January and a very productive CoCO2 kick-off meeting on 27/28 January marked the beginning of 2021…
PublishedDecember 18, 2020
A year of atmospheric CO2 variability at the time of the Paris Agreement
The CO2 Human Emissions (CHE) project has produced a new global simulation that realistically illustrates the variability of CO2 in the…